SHRI SHIVAJI SCIENCE COLLEGE, AMRAVATI
DBT STAR COLLEGE PROJECT ACTIVITY
ACTIVITY REPORT

Three-Day Training Program on “Data Analytical Tools”
Activity Dates: 11th – 13th September 2025
Type of Activity: Students Workshop
Organizing Department: Department of Computer Science
Program Coordinators: Dr. U.S. Junghare, Mr. Y.V. Hushare
Head of the Department: Dr. M.M.Bhonde
External Collaborator (if any): Inexgdata Technologies Pvt. Ltd.
Objectives:
- To provide hands-on exposure to modern Data Analytical Tools.
- To develop practical data analysis and visualization skills among students.
- To enable students to interpret and analyze datasets effectively using software tools.
- To bridge the gap between academia and industry through real-world analytics applications.
- To motivate students towards careers in data analytics and business intelligence.
No of Beneficieries: 66
Classes Involved: B.Sc. III Year Students (CSM & CAS)
Venue of the Activity: Computer Lab 5
Activity Report:
Introduction
The Department of Computer Science, in collaboration with the Department of Statistics, Shri Shivaji Science College, Amravati, successfully organized a Three-Day Training Program on “Data Analytical Tools” from 11th to 13th September 2025. The program was conducted in association with the Research and Incubation Foundation, SGBAU, Amravati, and Inexgdata Technologies Pvt. Ltd., Pune, catalyzed under the DBT Star College Scheme (Strengthening Component).
The training aimed to provide students with hands-on exposure to data analytics tools, enhance their analytical skills, and bridge the gap between academic knowledge and industry demands. It was designed to help students understand business analytics concepts and visualization techniques using Excel and Tableau.
The inaugural session was held at Computer Lab, Shri Shivaji Science College, Amravati, in the presence of Dr. M. M. Bhonde, Head, Department of Computer Science, and Dr. U. S. Junghare and Mr. Y. V. Hushare, Departmental DBT Project Coordinators. Dr. D. D. Khedkar, DBT Star College Coordinator, highlighted the significance of analytical skills in the digital era and encouraged students to actively participate.
The Principal, Dr. G. V. Korpe, presided over the inaugural function and addressed the students on the importance of developing data literacy and adapting to evolving technologies in analytics and business intelligence.
The resource person, Mr. Aniruddha Shelotkar, Senior Data Engineer, Cybage Software Pvt. Ltd., Pune, conducted all three days of technical sessions through interactive lectures, demonstrations, and hands-on practice sessions. His sessions focused on business analytics, data visualization, and storytelling with data.
Objectives of Training
To provide hands-on exposure to modern Data Analytical Tools.
To develop practical data analysis and visualization skills among students.
To enable students to interpret and analyze datasets effectively using software tools.
To bridge the gap between academia and industry through real-world analytics applications.
To motivate students towards careers in data analytics and business intelligence.
Training Program Framework
The three-day training program was systematically designed to provide participants with both theoretical understanding and practical exposure to modern data analytics tools, with a special focus on Microsoft Excel and Tableau. The structure ensured a gradual progression from basic concepts to advanced applications, enabling students to build strong analytical and visualization skills.
Day 1: Business Analytics with Excel
The first day of the program focused on introducing the fundamental concepts of data analytics and its significance in various industries such as finance, marketing, healthcare, and education. Participants were familiarized with Microsoft Excel as a powerful and accessible data analytics tool. The session included hands-on training on data cleaning techniques, formatting of datasets, and the application of essential analytical functions such as sorting, filtering, conditional formatting, and basic formulas. Students were also guided through practical exercises involving the creation of Pivot Tables, charts, and simple dashboards, which helped them understand how raw data can be transformed into meaningful insights for business decision-making.
Day 2: Transition to Tableau
On the second day, the training progressed towards advanced data visualization using Tableau. The session began with an introduction to the principles of effective data visualization, emphasizing clarity, accuracy, and storytelling. Participants learned how to connect Excel datasets to Tableau and explored the Tableau interface, including worksheets, dashboards, and data panes. The resource person conducted live demonstrations, followed by hands-on practice sessions where students created various types of charts, graphs, and maps. The interactive nature of Tableau allowed participants to design dynamic dashboards, enhancing their ability to interpret and present data in a visually appealing manner.
Day 3: Tableau & Business Storytelling
The final day focused on integrating analytical and visualization skills to create impactful business stories. Participants were introduced to advanced visualization techniques and learned how to combine multiple charts into cohesive dashboards that effectively communicate insights. Real-world case studies and practical scenarios were discussed to illustrate how data analytics is applied in decision-making processes across industries. Students worked on mini-projects, developing their own dashboards and presenting them to the group. The trainer provided constructive feedback on design, clarity, and analytical interpretation. The program concluded with a valedictory session, during which certificates were distributed to all participants.
Day-wise Highlights
Day 1:
The inaugural session laid a strong foundation by introducing participants to the core concepts of data analytics and Excel-based data handling. Students gained hands-on experience in dataset preparation, including sorting, filtering, and summarizing data using various Excel functions. The use of Pivot Tables and charts enabled participants to visualize data trends and patterns effectively, helping them understand how data-driven insights support business decisions.
Day 2:
The second day marked a transition from basic analytics to advanced visualization techniques using Tableau. The resource person demonstrated the process of importing and connecting Excel data into Tableau and guided students in creating interactive dashboards. Participants actively engaged in designing charts and visual representations, which enhanced their understanding of data interpretation and presentation in a professional context.
Day 3:
The final day emphasized the importance of storytelling in data analytics. Participants learned how to present data in a structured and meaningful way by combining multiple visual elements into a unified dashboard. Student presentations provided an opportunity for peer learning, while expert feedback helped refine their analytical and visualization skills. The day concluded with discussions on career opportunities in the field of data analytics, motivating students to pursue further learning in this domain.
Feedback and Interaction
The training program received an overwhelmingly positive response from the participants. A total of 66 students actively participated in all sessions, demonstrating keen interest and enthusiasm throughout the program.
Key Highlights of Feedback:
Participants highly appreciated the hands-on training methodology, which enabled them to apply theoretical concepts in practical scenarios, thereby enhancing their confidence and skills.
The expertise and interactive teaching approach of the resource person made complex analytical concepts easy to understand and engaging.
Many students expressed a strong interest in further exploring Excel-based analytics and Tableau for academic projects and future career opportunities.
The program successfully provided insights into real-world data analysis workflows, helping students understand how analytics is used in business environments.
The interactive Q&A session at the end of the program allowed participants to clarify their doubts regarding tools, certifications, and career pathways in the field of data analytics.
Conclusion
The Three-Day Training Program on “Data Analytical Tools” was a great success, effectively achieving its objectives of imparting analytical knowledge and practical skills. The collaboration between the Departments of Computer Science and Statistics, supported by the DBT Star College Scheme, and the expert guidance of Inexgdata Technologies Pvt. Ltd., made the event highly impactful.
The program fostered a deeper understanding of analytical tools among students, preparing them for industry-relevant challenges and future career opportunities in data science and business analytics.
Outcomes:
- Students gained practical exposure to Excel and Tableau as professional data analytics tools.
- Participants learned to design interactive dashboards and visual reports.
- The program created awareness about career pathways in data analytics, visualization, and BI tools.
- The training enhanced students’ data interpretation and presentation skills.
- Students developed confidence to handle real datasets and perform business-oriented analysis.
Photos:
 Day1Session on DataAnalyticalTools | 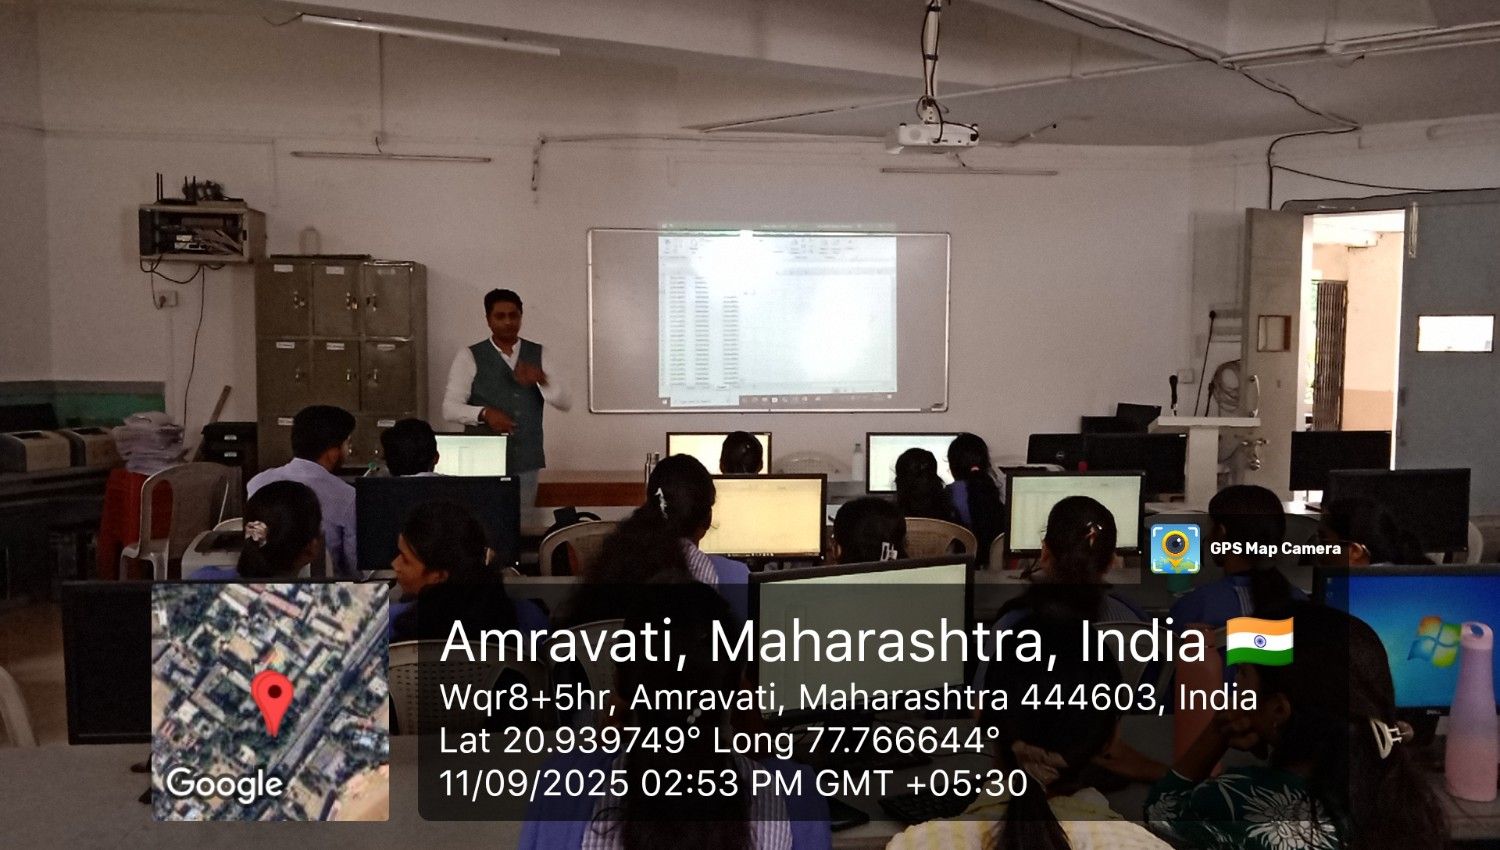 Day1: Students participation in Session on Data Analytical Tools |
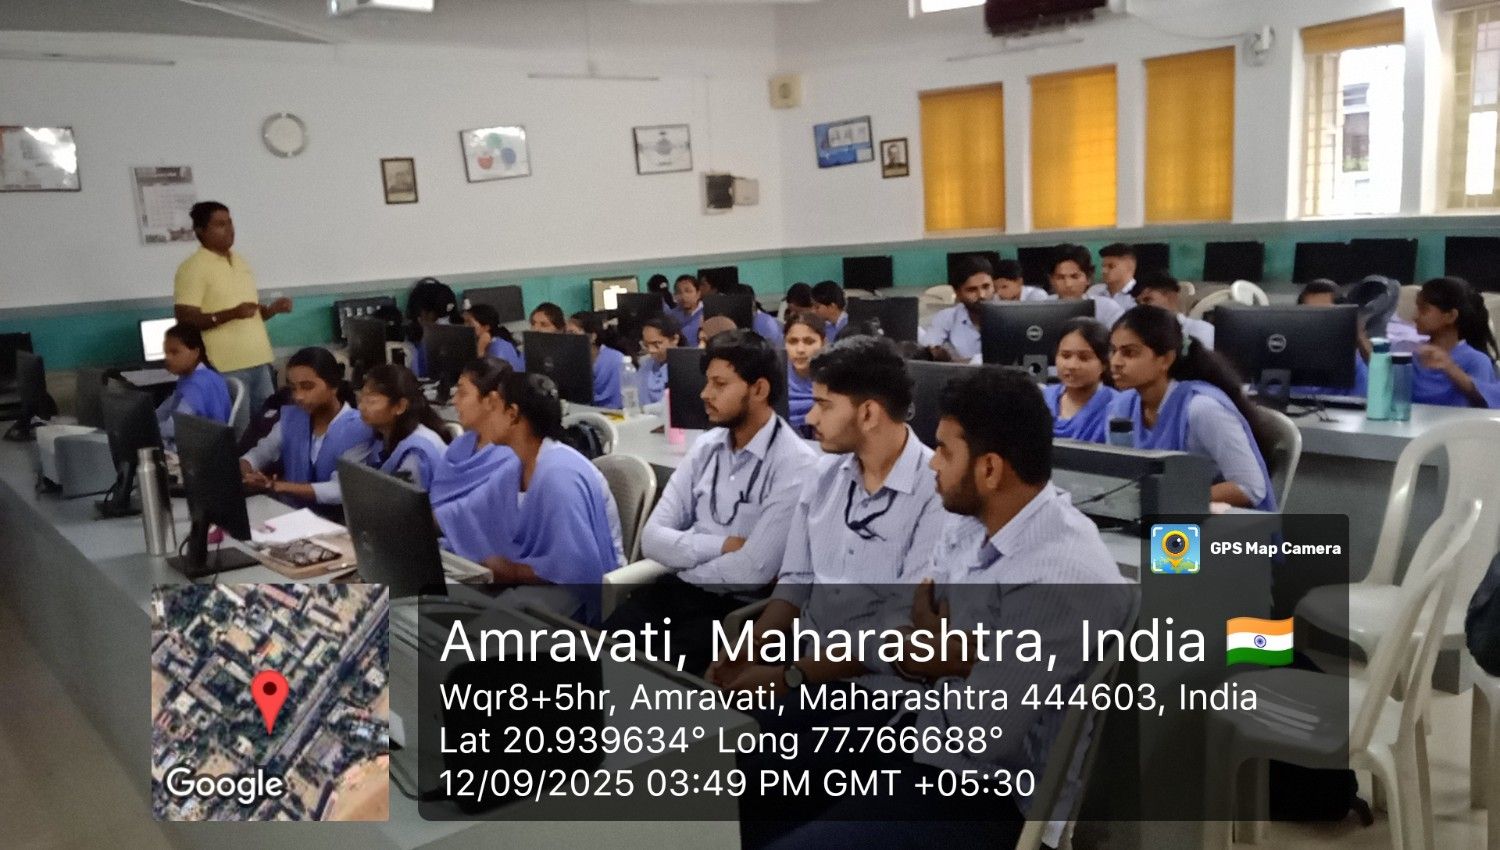 Day2 Sessionon Data Analytical Tools Session by Dr Aniruddha Shelotkar | 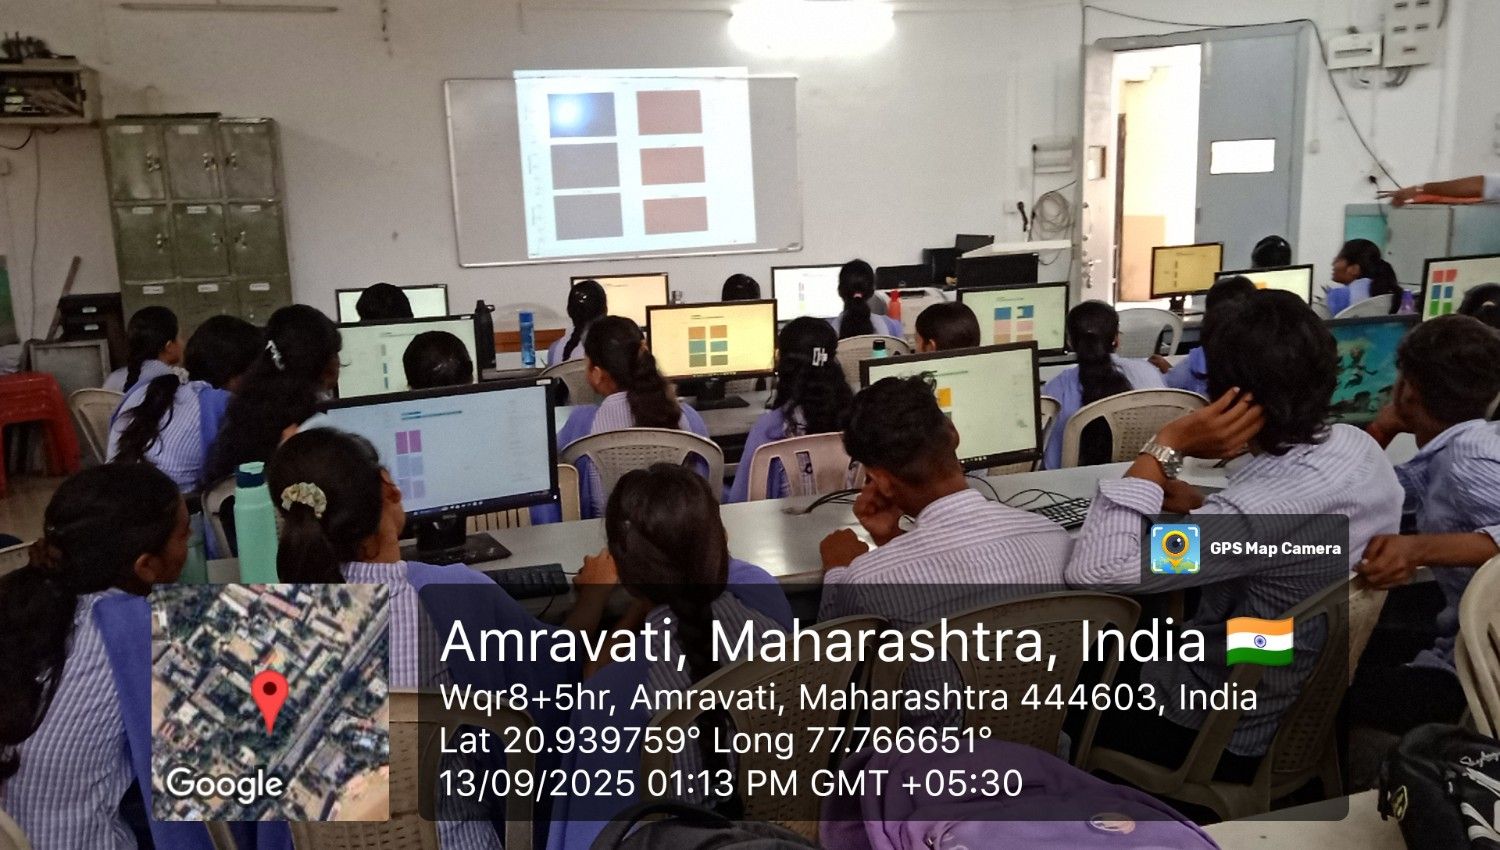 Day2 Students participation in Data Analytical Tools Session by Dr Aniruddha Shelotkar |
 Day2 Students participation in Data Analytical Tools Session |  Day3 Students participation in Data Analytical Tools Session by Dr Aniruddha Shelotkar |
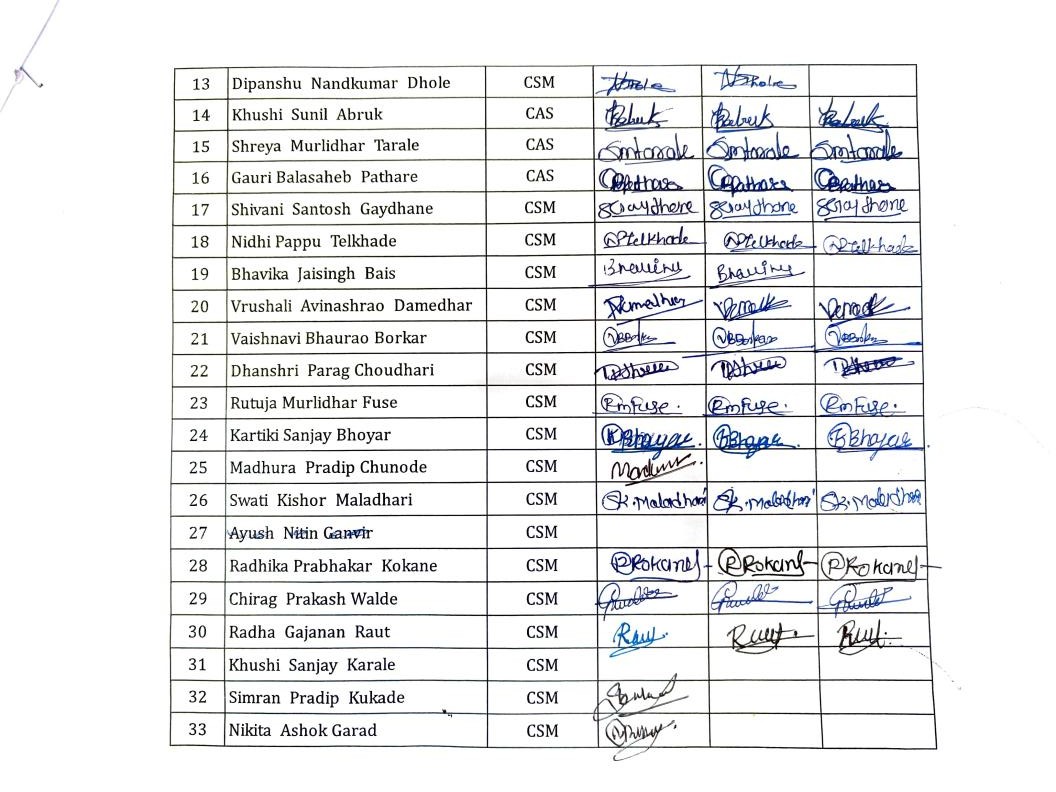
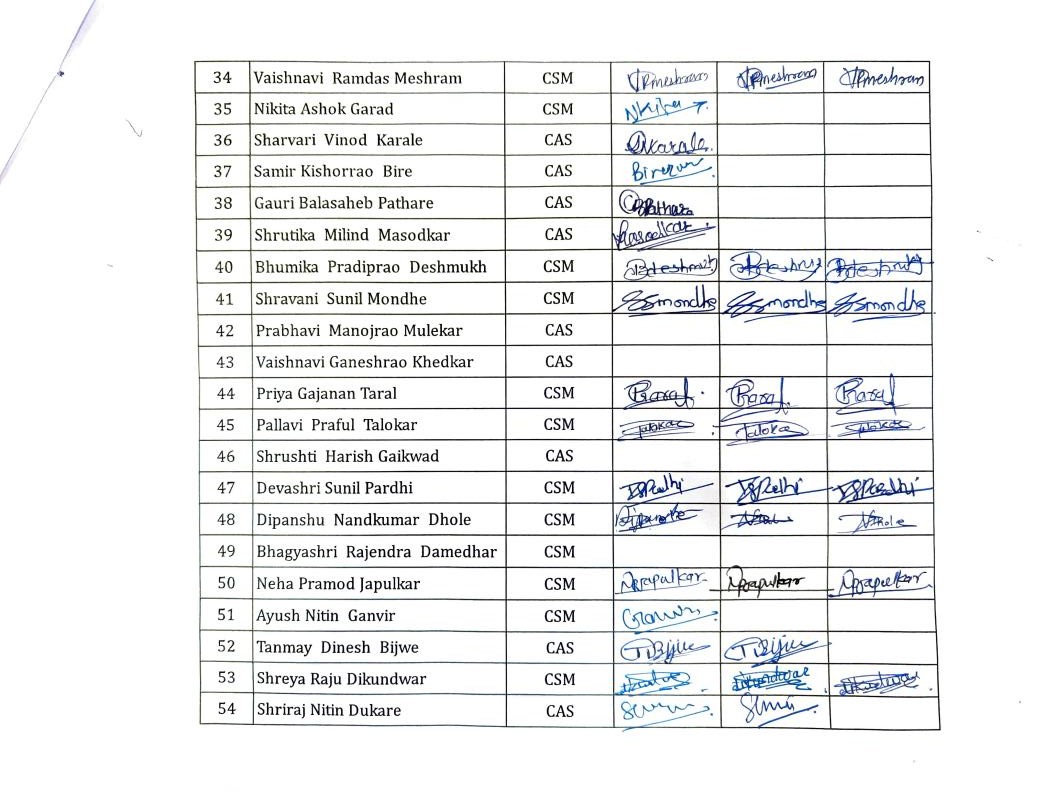
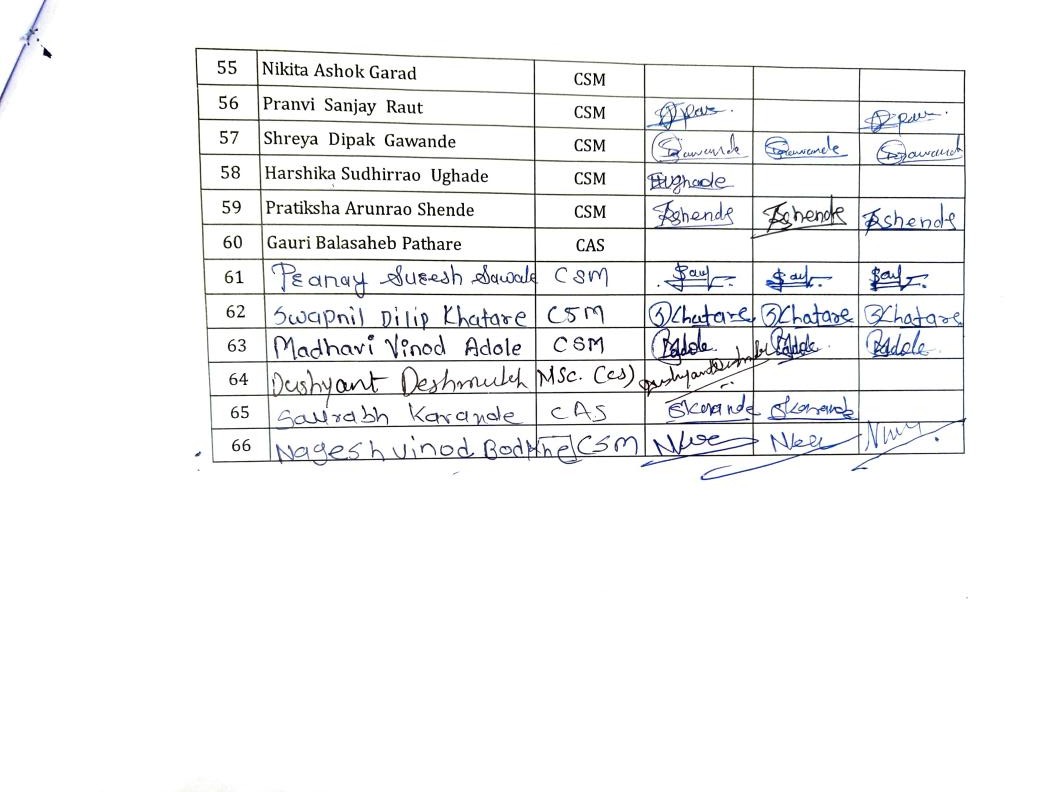
Attendance Sheet:
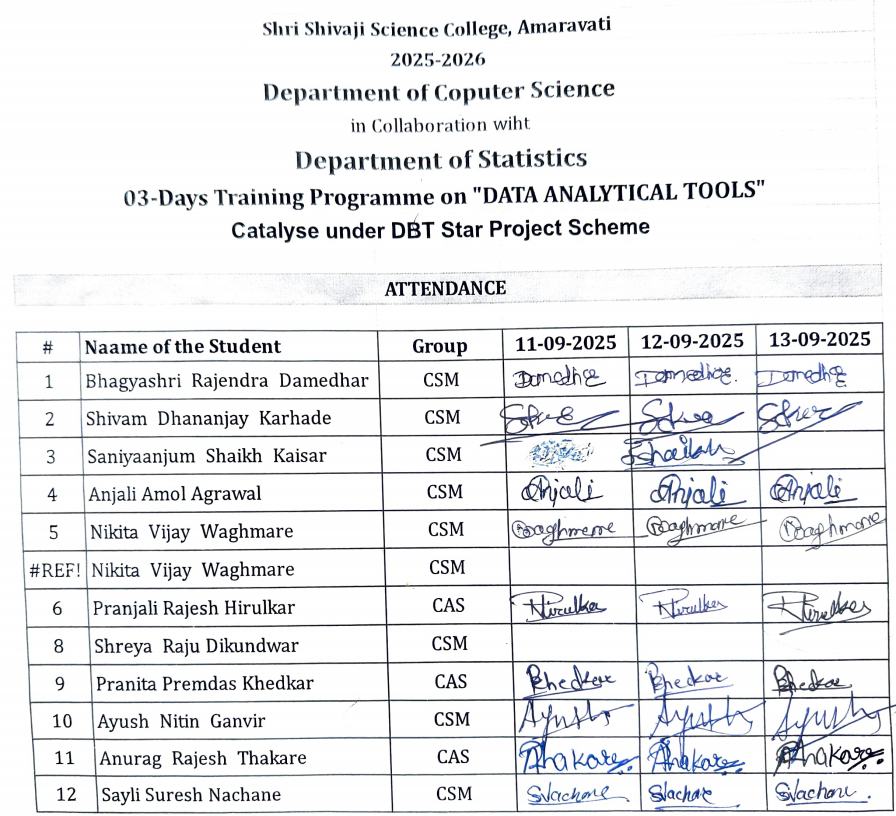 |
 |
 |
 |